Property Prices Increase In Q2 As Sales, Launches Improve: PropTiger Real Insight Report
Property prices in India’s eight prime residential markets have firmed up further during the April-June period of 2022 in the backdrop of geopolitical issues, a spike in rates of construction materials and an increase in home loan interest rates.
According to Real Insight Residential – April-June 2022 report, a quarterly analysis of India’s top eight residential markets, home sales and new supply numbers have also improved during the three-month period due to sustained demand momentum.
“Even though the RBI increased the repo rate twice during the quarter to bring it to 4.90%, home loans remained largely affordable for the period analysed. The biggest booster to housing demand has been the increased importance of owning a property which has been further backed by the consumers’ confidence in the overall economic scenario and impending income stability,” said Vikas Wadhawan, group CFO, Housing.com, PropTiger.com and Makaan.com.
The markets covered in the report include Ahmedabad, Bangalore, Chennai, Hyderabad, Kolkata, Mumbai Metropolitan Region, Delhi-National Capital Region, and Pune.
Mumbai contributes most to new supply
Barring Pune and Delhi-NCR, new launches increased in every city covered in the analysis. Mumbai, however, contributed the most to the quarterly launch numbers.
| New Supply – Quarterly | |||||
City | 2022 | 2021 | QoQ | YoY | |
Q2 2022 | Q1 2022 | Q2 2021 | |||
Ahmedabad | 9,500 | 5,060 | 1,540 | 88% | 516% |
Bangalore | 12,730 | 7,070 | 3,430 | 80% | 272% |
Chennai | 1,830 | 1,630 | 490 | 12% | 274% |
Delhi NCR | 2,970 | 4,270 | 820 | -31% | 262% |
Hyderabad | 16,480 | 14,570 | 8,810 | 13% | 87% |
Kolkata | 2,010 | 990 | 1,010 | 103% | 98% |
Mumbai | 43,220 | 30,360 | 2,930 | 42% | 1377% |
Pune | 13,390 | 15,580 | 2,810 | -14% | 376% |
India | 1,02,130 | 79,530 | 21,840 | 28% | 368% |
*Units converted to nearest thousands
Source: Real Insight Residential – April-June 2022, PropTiger Research
Ahmedabad, Hyderabad shows highest sales growth
Housing sales showed a sequential 5% uptick when compared to the previous quarter (Q1 CY2022) . According to the report, 74,330 units were sold across the top eight in Q2 2022 as compared to 70,620 units sold in Q1 2022. The sharpest quarterly increase in sales was witnessed in end-user driven markets of Ahmedabad at 30% and Hyderabad at 21%.
Sales – Quarterly | |||||
City | 2022 | 2021 | QoQ | YoY | |
Q2 2022 | Q1 2022 | Q2 2021 | |||
Ahmedabad | 7,240 | 5,550 | 1,280 | 30% | 465% |
Bangalore | 8,350 | 7,670 | 1,590 | 9% | 425% |
Chennai | 3,220 | 3,300 | 710 | -2% | 354% |
Delhi NCR | 4,520 | 5,010 | 2,830 | -10% | 60% |
Hyderabad | 7,910 | 6,560 | 2,430 | 21% | 226% |
Kolkata | 3,220 | 2,860 | 1,250 | 13% | 157% |
Mumbai | 26,150 | 23,360 | 3,380 | 12% | 673% |
Pune | 13,720 | 16,310 | 2,500 | -16% | 450% |
India | 74,330 | 70,620 | 15,970 | 5% | 365% |
Source: Real Insight Residential – April-June 2022, PropTiger Research
Pune, Chennai shows sharpest price growth
While all cities covered in the analysis showed an upwards movement in average rates of new property, Pune and Chennai recorded the highest annual appreciation of 9% each. Housing affordability remains the highest in Ahmedabad, where average rates of property stand in the range of Rs 3,500 to Rs 3,700 per sqft.
City-wise price break-up | ||
City | Rate in Rs per sq ft | YoY growth in % |
Ahmedabad | 3,500-3,700 | 8% |
Bangalore | 5,700-5,900 | 7% |
Chennai | 5,700-5,900 | 9% |
Delhi NCR | 4,600-4,800 | 6% |
Hyderabad | 6,100-6,300 | 7% |
Kolkata | 4,400-4,600 | 5% |
Mumbai | 9,900-10,100 | 6% |
Pune | 5,400-5,600 | 9% |
India | 6,600-6,800 | 7% |
*Weighted average prices as per new supply and inventory
Source: Real Insight Residential – April-June 2022, PropTiger Research
Inventory overhang at 34 months
Positive buyer sentiment has also been instrumental in bringing down the inventory overhang to 34 months from 42 months during the last quarter. For the uninitiated, inventory overhand is the estimated time period developers are likely to take to sell off the unsold inventory, based on the current sales velocity. As of June 2022, builders in India’s eight residential markets were sitting on an unsold stock consisting of 763,650 units.
| Unsold stock | ||
| City | Number of units as of June 2022 | Inventory overhang in months |
| Ahmedabad | 64,860 | 33 |
| Bangalore | 70,530 | 26 |
| Chennai | 32,670 | 27 |
| Delhi NCR | 99,850 | 65 |
| Hyderabad | 82,220 | 37 |
| Kolkata | 22,640 | 24 |
| Mumbai | 271,890 | 38 |
| Pune | 117,990 | 25 |
| India | 763,650 | 34 |
Source: Real Insight Residential – April-June 2022, PropTiger Research
***
Residential real estate growth continues in Q1 2022: Proptiger.com reportHome sales and new launch numbers have shown a year-on-year growth in the period between January and March, 2022, according to PropTiger.com’s Real Insight Residential report
March 31, 2022:
Activity in India’s residential real estate segment has seen a further increase in the first three months of the year 2022, as record low home loan interest rates fuel consumer enthusiasm, along with government-sponsored subsidy programmes.
According to a report by online real estate major PropTiger.com, which is part of REA India that also owns Housing.com and Makaan.com, home sales and new launch numbers have shown a year-on-year (YoY) growth in the period between January and March, 2022.
The report by the Gurgaon-headquartered company shows that 70,623 units were sold in Q1 2022, as compared to 66,176 units sold in Q1 2021, registering 7% YoY growth. The improvement in terms of new supply was significantly higher, with a YoY growth of 50% in new launches during the same period. A total of 79,532 units were launched in Q1 2022 as compared to 53,037 units in Q1 2021.
The markets covered in the quarterly report, titled Real Insight Residential – January-March 2022, include Ahmedabad, Bangalore, Chennai, Hyderabad, Kolkata, Mumbai Metropolitan Region, Delhi-National Capital Region and Pune.
“India’s housing sector is again emerging as a bright spot in the country’s economy, helping it spring out of the pandemic-induced slowdown. With further normalisation of activity in the months to follow, we expect greater positive changes,” said Dhruv Agarwala, group CEO, PropTiger.com, Housing.com and Makaan.com
79% sales in Q1 reported in under-construction segment
Sales | |||
City | Q1 2022 | Q1 2021 | YoY change % |
Ahmedabad | 5,549 | 4,687 | 18% |
Bangalore | 7,671 | 7,431 | 3% |
Chennai | 3,299 | 4,468 | -26% |
Delhi NCR | 5,013 | 6,188 | -19% |
Hyderabad | 6,556 | 7,721 | -15% |
Kolkata | 2,860 | 3,382 | -15% |
Mumbai | 23,361 | 18,574 | 26% |
Pune | 16,314 | 13,725 | 19% |
India | 70,623 | 66,176 | 7% |
Source: Real Insight (Residential) January—March 2022
In a quarter during which the demand for housing units priced in the range of Rs 45 lakhs to Rs 75 lakhs was the highest, Mumbai and Pune had the biggest share in housing sales, with their combined share standing at 56% of the overall sales.
Even though the recent joint consumer survey conducted by the group company of REA India, Housing.com and industry body NAREDCO, found that 57% of potential homebuyers would prefer to buy a ready-to-move-in (RTMI) property, 79% of the sales during the quarter ended in March was seen in the under-construction category, mainly because of the price advantage that this segment offers over the ready-to-move-in segment.
Half the cities show decline in launches
The MMR market did the heavy lifting in terms of new supply in the quarter ended March 31, demonstrating a 246% increase YoY. The stellar performance by this market was mainly responsible for an overall good performance of the housing market on this parameter, as four of the eight markets covered in the analysis showed a decrease in new launches. Cities where new launches showed a decline during the March quarter include Ahmedabad, Chennai, Delhi-NCR and Kolkata.
New supply | |||
City | Q1 2022 | Q1 2021 | YoY change % |
Ahmedabad | 5,055 | 9,064 | -44% |
Bangalore | 7,068 | 5,518 | 28% |
Chennai | 1,629 | 5,556 | -71% |
Delhi NCR | 4,270 | 4,778 | -11% |
Hyderabad | 14,572 | 7,604 | 92% |
Kolkata | 994 | 1,999 | -50% |
Mumbai | 30,360 | 8,770 | 246% |
Pune | 15,584 | 9,748 | 60% |
India | 79,532 | 53,037 | 50% |
Source: Real Insight (Residential) January—March 2022
Property prices climb too
As expected, housing price growth also accelerated during the quarter, with every market covered in the analysis showing an upwards movement in average rates of new properties. Most of this increase in rates can be attributed to the hike in prices of building materials.
The sharpest uptick in property prices was registered in Chennai, where average rate of properties has undergone a 9% appreciation in the past one year, the report shows. Pune and Ahmedabad followed this southern market closely in terms of price increase, with both markets witnessing an 8% rise in their average property rates.
City-wise price card | ||
City | Price range in Rs per sq ft as on March 2022* | YoY % growth |
Ahmedabad | 3,500-3,700 | 8% |
Bangalore | 5,600-5,800 | 6% |
Chennai | 5,700-5,900 | 9% |
Delhi NCR | 4,500-4,700 | 4% |
Hyderabad | 6,000-6,200 | 7% |
Kolkata | 4,300-4,500 | 5% |
Mumbai | 9,800-10,000 | 4% |
Pune | 5,400-5,600 | 8% |
India | 6,600 - 6,700 | 7% |
Source: Real Insight Residential – January-March 2022, PropTiger Research
*Weighted average prices as per new supply and inventory
Agarwala is of the opinion that house ownership may become pricier with various government-funded subsidy schemes coming to an end in March 2022. This price appreciation would be further compounded by rising home loan rates, if the RBI were to hike the benchmark lending rate, which may well be on the cards, given inflationary pressures. So far, the country’s central bank has maintained the repo rate - to which home loan interest rates in India are linked - at 4%.
Housing inventory increases marginally amid higher supply numbers
As activity in housing supply picked up pace, housing inventory swelled slightly, at an annual rate of 4%. Builders in India are sitting on an unsold stock consisting of 7,35,852 units as on March 31, 2022. This number stood at 7,05,344 units at the end of March 2021. With an individual share of 35% and 16%, respectively, Mumbai and Pune continue to contribute the most to this national housing inventory.
However, inventory overhang - the estimated period builders are likely to take to sell off their unsold stock - has declined to 42 months as against 47 months a year ago, primarily because of higher demand for housing. Delhi NCR has the highest inventory overhang while Bangalore and Kolkata have the lowest.
India’s unsold residential inventory | ||
City | Unsold stock as on March 31, 2022 | Inventory overhang in months |
Ahmedabad | 62,602 | 42 |
Bangalore | 66,151 | 31 |
Chennai | 34,059 | 34 |
Delhi NCR | 1,01,404 | 73 |
Hyderabad | 73,651 | 42 |
Kolkata | 23,850 | 31 |
Mumbai | 2,55,814 | 48 |
Pune | 1,18,321 | 32 |
India | 7,35,852 | 42 |
Source: Real Insight (Residential) – January-March 2022, PropTiger Research
***
Homes sales, new supply improve in 2021 driven by policy initiatives and improved buyer sentiment: PropTiger.com reportHome sales, new supply numbers jump on cues from economic recovery and record low home loan interest rates.
February 17, 2022: Real estate activity in India’s leading housing markets intensified towards the second half of 2021, after a grim 18 months in which Asia’s third-largest economy was consistently battered by multiple waves of the coronavirus pandemic, shows the latest report by PropTiger.com, the country’s leading online real estate brokerage company.
According to the report titled Real Insight Residential – Annual Round-up 2021, home sales in India’s eight prime housing markets increased 13% in 2021, when compared to the overall sales in 2020. The figures include the sales numbers for all the four quarters in both calendar years.
A much sharper growth was seen in terms of new supply in 2021 as against 2020---a total of 2.14 lakh units were launched in 2021 compared to 1.22 lakh units in the preceding year, showcasing an upward swing of 75%.
This improvement in key growth metrics for the sector, the second-largest employment generator in India after agriculture, could largely be attributed to support measures launched by the government in the aftermath of the coronavirus pandemic, improved consumer sentiment, stable prices and historically high housing affordability.
Mumbai, Pune steer sales upswingBuilders sold 2,05,936 housing units for the full year 2021 as against 1,82,639 units in 2020. This growth in sales was largely driven by India’s financial capital Mumbai, where a total of 58,556 homes were sold in 2021. Closely following the Maximum City was its neighbour Pune, where a 9% jump resulted in sale of 42,425 apartments last year, the report by the Gurgaon-headquartered real estate firm shows.
Flexible payment plans continue to keep homebuyers inclined towards under-construction homes, which made up for 80% of the home sales during the year, the report adds.
Sales | 2021 | 2020 | QoQ | YoY | |
City | Qtr4 | Qtr3 | Qtr4 | ||
Ahmedabad | 5,423 | 5,483 | 3,125 | -1% | 74% |
Bengaluru | 9,414 | 6,547 | 7,660 | 44% | 23% |
Chennai | 3,213 | 4,665 | 3,180 | -31% | 1% |
Delhi NCR | 4,433 | 4,458 | 6,065 | -1% | -27% |
Hyderabad | 4,277 | 7,812 | 6,487 | -45% | -34% |
Kolkata | 2,610 | 2,651 | 2,518 | -2% | 4% |
Mumbai | 22,438 | 14,163 | 18,331 | 58% | 22% |
Pune | 16,077 | 10,128 | 11,548 | 59% | 39% |
Total | 67,885 | 55,907 | 58,914 | 21% | 15% |
Source: Real Insight Residential – Annual Round-up 2021, PropTiger Research
Annual Sales | |||
City | 2021 | 2020 | YoY |
Ahmedabad | 16,875 | 12,156 | 39% |
Bangalore | 24,983 | 23,458 | 7% |
Chennai | 13,055 | 10,452 | 25% |
Delhi NCR | 17,907 | 17,789 | 1% |
Hyderabad | 22,239 | 16,400 | 36% |
Kolkata | 9,896 | 9,061 | 9% |
Mumbai | 58,556 | 54,237 | 8% |
Pune | 42,425 | 39,086 | 9% |
India | 2,05,936 | 1,82,639 | 13% |
Source: Real Insight Residential – Annual Round-up 2021, PropTiger Research
Buyer sentiment driving new launch waveAmid a visible change of approach towards housing ownership among consumers in the aftermath of the pandemic, real estate developers in India stepped up efforts to offer better housing choices in 2021. As a result of this, barring Chennai where a marginal decline was seen, new supply showed a jump in all cities covered in the analysis during the year.
"Beyond the numbers which speak for themselves, what is remarkable is the resilience of the real estate market in India. Despite multiple waves of the pandemic, which resulted in multiple lockdowns, the residential real estate market has not only bounced back but is also on the cusp of a cyclical upturn. With policy support from the government and the low interest rate regime maintained by the RBI, I am very confident about the sector, entering into 2022,” said Dhruv Agarwala, Group CEO, Housing.com, Makaan.com & PropTiger.com.
“Developers have been quick to respond to the positive changes in buyer sentiment, as evidenced by the offers available in the market, especially during the festive season of 2021, which resulted in improved metrics for both, demand and supply. Basis the data available with us, it seems very likely that we will see an increase in prices in 2022, even as the inventory overhang continues to decline in 2022. The biggest trend we foresee is that the real estate market will continue to consolidate its growth in 2022 as well,” said Rajan Sood, Business Head, PropTiger.com.
New Launch | 2021 | 2020 | QoQ | YoY | |
City | Qtr4 | Qtr3 | Qtr4 | ||
Ahmedabad | 17,311 | 13,440 | 3,003 | 29% | 476% |
Bengaluru | 8,524 | 3,072 | 6,104 | 177% | 40% |
Chennai | 3,797 | 2,332 | 4,887 | 63% | -22% |
Delhi NCR | 6,021 | 1,748 | 5,120 | 244% | 18% |
Hyderabad | 19,809 | 12,342 | 12,723 | 61% | 56% |
Kolkata | 1,944 | 442 | 1,658 | 340% | 17% |
Mumbai | 9,868 | 21,820 | 10,070 | -55% | -2% |
Pune | 7,035 | 10,015 | 10,764 | -30% | -35% |
Total | 74,309 | 65,211 | 54,329 | 14% | 37% |
Source: Real Insight Residential – Annual Round-up 2021, PropTiger Research
Increase in raw material price pushed property prices up in 2021Consistent increase in raw materials prices is pushing up property prices, with all eight prime residential markets covered in the report showing annual increase in per square foot price of new properties. Ahmedabad and Hyderabad housing markets were leading this pack, with an annual price hike of 7% each in 2021.
City-Wise Price card | ||
City | Weighted average price in Rs per square foot as on December 2021 | YoY % growth |
Ahmedabad | 3,400-3,600 | 7% |
Bangalore | 5,500-5,700 | 6% |
Chennai | 5,400-5,600 | 5% |
Delhi NCR | 4,400-4,600 | 5% |
Hyderabad | 5,900-6,100 | 7% |
Kolkata | 4,300-4,500 | 5% |
Mumbai | 9,700-9,900 | 4% |
Pune | 5,100-5,300 | 3% |
India | 6,300 - 6,500 | 6% |
Source: Real Insight Residential – Annual Round-up 2021, PropTiger Research
Inventory overhang declines to 3.5 yearsThe improvement in sales in 2021 has been instrumental in lowering the inventory burden for India’s real estate developers. Consequently, inventory overhang --- the estimated time builders would take to sell off the existing unsold stock, based on the current sales velocity--- has now declined to 42 months. As on December 31, 2021, builders had an unsold stock consisting of 7,26,943 units in India’s eight housing markets. While the inventory overhang is the highest for the Delhi-NCR market at 68 months, it is the lowest for Kolkata, at 31 months.
India’s inventory burden | ||
City | Unsold stock on December 30, 2021 | Inventory overhang in months |
Ahmedabad | 63,096 | 45 |
Bangalore | 66,754 | 32 |
Chennai | 35,729 | 33 |
Delhi NCR | 1,02,147 | 68 |
Hyderabad | 65,635 | 35 |
Kolkata | 25,716 | 31 |
Mumbai | 2,48,815 | 51 |
Pune | 1,19,051 | 34 |
India | 7,26,943 | 42 |
Source: Real Insight Residential – Annual Round-up 2021, PropTiger Research
NOTE: Housing markets covered in the report includes Ahmedabad, Bangalore, Chennai, Hyderabad, Kolkata, Delhi-NCR (Gurugram, Noida, Greater Noida, Ghaziabad and Faridabad) , MMR (Mumbai, Navi Mumbai & Thane) and Pune
***
Positive Sentiment, Increased Affordability Boost Home Sales, Supply In Q3: PropTiger ReportHomes sales and new supply numbers began to witness appreciation amid economic indicators signaling signs of an overall recovery in India, data show.
According to Real Insight (Residential) : July – September (Q3) 2021, a quarterly analyses of India’s eight prime residential markets by REA India-owned real estate company PropTiger.com, demand and supply metrics have shown a significant improvement in the period between July and September 2021 (Q3 CY2021) , indicating that the nascent recovery for India’s second-largest employment-generating sector could firm up further during the ongoing festive season.
Sales jump on the back of improved consumer confidence
According to the report, that analyses housing markets of Ahmedabad, Bengaluru, Chennai, Hyderabad, Kolkata, NCR, MMR and Pune, a total of 55,907 new housing were sold in these markets during the three-month period in July and September, an increase of 59% when compared to the corresponding period in 2020.
Sales show quarterly, as well as annual jumpSales | 2021 | 2020 | QoQ | YoY | |
City | Q3 | Q2 | Q3 | ||
Ahmedabad | 5,483 | 1,282 | 3,339 | 328% | 64% |
Bengaluru | 6,547 | 1,591 | 4,825 | 312% | 36% |
Chennai | 4,665 | 709 | 2,317 | 558% | 101% |
Delhi NCR | 4,458 | 2,828 | 4,427 | 58% | 1% |
Hyderabad | 7,812 | 2,429 | 3,260 | 222% | 140% |
Kolkata | 2,651 | 1,253 | 2,479 | 112% | 7% |
Mumbai | 14,163 | 3,381 | 7,378 | 319% | 92% |
Pune | 10,128 | 2,495 | 7,107 | 306% | 43% |
Total | 55,907 | 15,968 | 35,132 | 250% | 59% |
Source: Real Insight (Residential) – July-September (Q3) 2021
The manifold quarter-on-quarter (QoQ) jump in home sales in the quarter-ended September 30, 2021, was much higher, primarily because of the low benchmark - only 15,968 units were sold during the May-July period this year (Q2 2021) , the report shows.
Units in the price bracket of less-than-Rs-45-lakhs contributed the highest to the quarterly sales, by claiming a 40% share in the overall sales, it added.
The tremendous jump in sales numbers could also be attributed to the 10-year-low home loan interest rates - home loans are currently available at 6.50% annual interest.
Improved liquidity, demand result in three-fold jump in new supplyAmid an economic uncertainty that weighed heavy on new supply during the period starting March 2020, launches had shown severe fall since. However, Q3 CY2021 saw launches showing manifold increase in numbers on the back of improved liquidity conditions and support policies.
After a prolonged period of decline, new supply in India’s eight prime residential markets also saw a remarkable upswing in Q3, showing a three-fold jump of 228% to 65,211 units when compared to Q3 2020 wherein a total of 19,865 units were launched in these eight prime real estate markets.
The sequential increase in the new supply was also not any less impressive - a total 21,836 units were launched in Q2 of the calendar year, indicating a 199% jump in Q3.
Of the total units launched in Q3, 33% were from the Rs 45-75 lakhs price bracket, the highest number of launches seen in any segment during the quarter. Mumbai (33%) and Ahmedabad (21%) saw the highest number of quarterly launches.
Inventory overhang declines to 44 months; further improvement likely during the festive seasonAs on September 30, 2021, builders in India had an unsold stock consisting of 7,20,519 units across the eight residential markets. Even though new supply numbers added to the overall number of units available for purchase in the eight housing markets, the inventory overhang during Q32021 declined to 44 months from 48 months in the previous quarter.
This decline in the inventory overhang - the estimated period builders in a particular market are likely to take to sell off their unsold stock at the existing sales velocity - can be attributed to the upswing in demand during the quarter, which is likely to improve further in Q4. This may lead to further reduction in the inventory overhang during the festive season.
While the NCR has the highest inventory overhang of 62 month, Hyderabad has the lowest inventory overhang at 25 months. Kolkata has the lowest inventory stock in the country while the MMR market has the highest unsold stock.
Unsold stock: City-wise break-upCity | Unsold inventory as on September 30, 2021 | Inventory overhang in months |
Ahmedabad | 51,208 | 42 |
Bengaluru | 67,644 | 35 |
Chennai | 35,145 | 32 |
Delhi NCR | 100,559 | 62 |
Hyderabad | 50,103 | 25 |
Kolkata | 26,382 | 32 |
Mumbai | 261,385 | 58 |
Pune | 128,093 | 41 |
Pan India | 720,519 | 44 |
Source: Real Insight (Residential) – July-September (Q3) 2021
Overall price growth remains muted; average growth remains positive for AhmedabadAs supply-side issues continued to impact the cost of undertaking housing projects in India in the aftermath of the pandemic, all housing markets included in the analysis showed only a slight uptick in average prices of flats and villas. The price rally seen in Ahmedabad was the sharpest during the quarter.
Price growth: City-wise break-upCity | Average price range as on September 30, 2021 (in Rs per sq ft) * | Annual growth in % |
Ahmedabad | 3,300 - 3,500 | 8 |
Bangalore | 5,400 - 5,600 | 4 |
Chennai | 5,300 - 5,500 | 3 |
Hyderabad | 5,800 - 6,000 | 6 |
Kolkata | 4,100 - 4,300 | 2 |
MMR | 9,600 - 9,800 | 3 |
NCR | 4,300 - 4,500 | 5 |
Pune | 5,000 -5,200 | 4 |
National average | 6,200 - 6,400 | 5 |
Source: Real Insight (Residential) – July-September (Q3) 2021
*All prices are weighted average prices as per new supply and inventory.
‘Festive season to bring about complete turn-around’
With key growth indicator already moving in the right direction, the ongoing festive season is likely to speed up the pace of recovery for real estate, the report says.
“It is now a well-established fact that the notion of property ownership has gained significant currency in the aftermath of COVID and its impact on the way people live and work. Even as this has helped build positive consumer sentiment vis-à-vis residential real estate, support measures by the government and the banking sector have set the ball rolling for a positive change in momentum for the sector. In combination, these two factors have helped drive both, demand and supply, metrics upwards during the July-September quarter of 2021,” says Dhruv Agarawala, group CEO, Housing.com, PropTiger.com and Makaan.com.
“The stage is now set for the festive season to give that much-desired fillip for the industry that it has been eagerly awaiting and working so hard for,” Agarwala adds.
Rajan Sood, business head, PropTiger.com said, “Considering housing affordability is at a record high this festive season on the back of 10-year low home loan interest rates and sops offered by some state governments in the form of reduced stamp duties and circle rates, we expect housing markets in the top 8 cities to show solid stability in the ongoing quarter. Though the overall cost of construction has gone up due to the rise in the cost of crucial input materials, rather than seeing an increase in prices, buyers are being offered discounts during the festive season.”
“States can support the recovery process further by either announcing newer incentives for homebuyers or by extending or launching stamp duty and circle rate waivers,” Sood added.
***
Property Prices In Ahmedabad, Hyderabad Rise In Q2 CY21 Despite COVID-19 Second Wave: PropTiger ReportJuly 6, 2021: Some housing markets in India continue to show remarkable resilience as they continue to see value appreciation, the overall negative impact of the second wave of the Coronavirus pandemic notwithstanding.
According to Real Insight (Residential) – April-June (Q2) 2021, a quarterly analysis of the country’s eight prime residential markets by Elara Technologies-owned real estate advisor PropTiger.com, the average value of new properties in Ahmedabad and Hyderabad has seen an individual 5% positive growth during the second quarter of the current calendar year (Q2CY21) .
Price growth: City-wise break-up
City | Average price as on June 30, 2021 (in Rs per sq ft) | Annual growth in % |
Ahmedabad | 3,251 | 5 |
Bangalore | 5,495 | 4 |
Chennai | 5,308 | 3 |
Hyderabad | 5,790 | 5 |
Kolkata | 4,251 | 2 |
MMR | 9,475 | No change |
NCR | 4,337 | 2 |
Pune | 5,083 | 3 |
National average | 6,234 | 3 |
Source: Real Insight: Q2 2021
While prices of flats and apartments have been consistently rising in Hyderabad since 2014, when Andhra Pradesh was bifurcated, the spike in values of properties in Ahmedabad is a new trend.
“The price rise in Ahmedabad could be attributed to the low base price of new properties. When compared to most other markets included in the analysis, Ahmedabad is the most affordable housing market right now, as far as average values are concerned. The recent increase in prices of construction materials caused by supply constraints is also fueling the price hike,” said Mani Rangarajan, group chief operating officer, Housing.com, Makaan.com and PropTiger.com.
In fact, because of the same concerns, all cities covered in the analysis showed positive price movement, no matter how insignificant, barring the MMR, where growth remained unchanged when compared to the April-June period of 2020.
New launches and supply take a hit
While liquidity-starved developers showed caution in launching new projects during the quarter, homebuyers also stayed put, with respect to making a move on their home-buying plans. This is despite the fact that the RBI continues to keep the repo rate unchanged at four per cent, helping the banking system to maintain a record low home loan interest rate regime - you can get a home loan at annual interest rates starting from 6.65 per cent.
According to the report, a total of 21,839 new units were launched in the eight markets during Q2CY21, showing a decline of 59 per cent, when compared to the January-March period of 2021. However, when compared to Q2CY20, new launches show an increase of 74 per cent.
Similarly, a total of 15,968 units were sold across these eight markets during the June quarter, showing a 16 per cent YoY decline and a 76 per cent quarterly fall.
“Due to the challenging situation during the April-June quarter in 2021, when infections and casualties caused by the Coronavirus hit a peak before subsiding towards the end of May, both, demand and supply, were hit during the first two months, when most states put in place various restrictions and lockdowns to curb the spread of the virus. However, some ground on both the numbers was covered during the month of June, when states started to open up. The same is reflected in Q2 demand and supply numbers. We expect improvement on both these indicators of residential real estate health in the upcoming quarters, since India’s vaccination programme is likely to gather pace. It is also important to mention that despite the lockdowns and subdued sentiment, the government gave the sector a much-needed boost with the passing of the Model Tenancy Act, which is expected to give a fillip to rental housing supply in the country. The RBI is also doing its bit by continuing to maintain its accommodative stance, keeping the repo rate and reverse repo rate at a status quo of 4% and 3.35%, respectively, which in turn would allow the low mortgage interest rate regime for home buyers, to continue. All these measures, combined with latent demand, will certainly help our sector to bounce back faster than what was anticipated earlier,” said Dhruv Agarwala, group CEO, Housing.com, Makaan.com and PropTiger.com.
Unsold stock remains nearly the same as last year
Owing to pressure from the demand side, the unsold housing stock remained nearly the same. As on June 30, 2021, these housing markets had a total of 7,11,215 unsold units. Due to similar reasons, the inventory overhang also increased to 48 months from 47 in the previous quarter. Inventory overhang is the average estimated time that builders will take to sell off the existing unsold stock, at the current sales velocity.
“While the impact of the second wave of the virus was universal, some markets were impacted more, as they were the hardest hit by the pandemic. This has been reflected in the high levels of unsold inventory and higher inventory overhang in markets like the NCR and MMR. This is especially true of the NCR market, where the inventory overhang was as high as the MMR, even though the unsold stock in that market was less than half of what is there in the MMR,” said Rangarajan.
The report points out that the NCR market continues to suffer, not only from high levels of unsold inventory but also from a remarkably high overhang.
While the MMR market had an unsold housing inventory over twice the size of that in the NCR, the inventory overhang for both the markets was the same, i.e., 64 months. Pune also has a considerably high unsold inventory, data show.
Unsold stock: City-wise break-up
City | Unsold stock on June 30, 2021 | Inventory overhang (in months) |
Ahmedabad | 43,251 | 42 |
Bangalore | 71,119 | 40 |
Chennai | 37,478 | 42 |
Hyderabad | 45,573 | 27 |
Kolkata | 28,591 | 36 |
MMR | 253,728 | 64 |
NCR | 103,269 | 64 |
Pune | 128,206 | 44 |
National average | 711,215 | 48 |
Source: Real Insight: Q2 2021
***
Sales Rise 12% In Jan-March Quarter Amid Increased Housing Affordability: PropTiger ReportApril 9, 2021: Housing sales in India’s most active residential markets showed an increase of 12 per cent during the January-March period of 2021 when compared to the October-December quarter of 2020, at a time when government support measures have increased housing affordability for India’s homebuyers, shows a report by online property brokerage company PropTiger.com.
Real estate developers in India’s eight prime residential markets sold a total of 66,176 apartments in the primary segment. This, however, is a decline of five per cent when compared to the sales numbers in the January-March period of 2020.
The report attributed the quarterly increase in home sales to stamp duty and circle rate reductions by states, and affordable lending rates by banks.
New supply increases 49% YoY
Marking an annual appreciation of 49 percent year-on-year, builders in India’s eight prime residential markets launched 53,037 units during the three-month period amid an improvement in the possibilities of securing funding. On the quarter-on-quarter (QoQ) basis, however, new launches showed a marginal decline of two per cent.
Prices growth remains stable
Barring Ahmedabad and Hyderabad, no other city included in the analysis showed any marked upwards movement in average annual values of property in the primary segment. Average values in both the cities improved by five per cent annually.
Annual price growth: City-wise break-up
City | Average price as on March 31, 2021 (in Rs per square foot) | Annual growth in % |
Ahmedabad | 3,234 | 5 |
Bangalore | 5,450 | 3 |
Chennai | 5,275 | 3 |
Hyderabad | 5,713 | 5 |
Kolkata | 4,208 | 1 |
MMR | 9,474 | No change |
NCR | 4,327 | 1% |
Pune | 5,76 | 3 |
National average | 6,234 | 3 |
Source: Real Insight: Q1 2021
Inventory declines but overhang increases
Despite an improvement in demand, there has not been any prominent change in the unsold stock in these markets. The unsold inventory in the eight markets stood at 705,344 as on March 31, 2021. The MMR and Pune contributed the most to this unsold stock, with a combined share of 54 per cent.
Also, despite the various government measures launched to support growth, demand has yet to reach the pre-Covid-19 level. This is reflected in the fact that inventory overhang —the estimated time builder would take to sell off the existing stock keeping in view the current sales velocity — has remained unchanged at 47 months as it was in the previous quarter.
Unsold stock: City-wise break-up
City | Unsold stock on March 31, 2021 | Inventory overhang |
Ahmedabad | 42,991 | 42 |
Bangalore | 69,285 | 37 |
Chennai | 37,697 | 40 |
Hyderabad | 39,191 | 25 |
Kolkata | 28,827 | 36 |
MMR | 254,183 | 62 |
NCR | 105,279 | 68 |
Pune | 127,891 | 41 |
National average | 705,344 | 47 |
Source: Real Insight: Q1 2021
“As the economy gradually marches towards recovery, as reflected in global rating agencies and think-tanks revising India’s growth forecasts for 2021 and 2022, the residential real estate market in the country is also seeing a positive momentum on the back of various measures taken by the centre and state governments, the RBI and the entire banking system (as demonstrated in home loan rate reductions) . This positive change is visible in the first quarter through an increase in supply numbers, an indication that developers are more comfortable now with regard to liquidity support and buyer sentiment,” said Dhruv Agarwala, group CEO, Housing.com, Makaan.com and PropTiger.com.
“The metrics on the demand side have also been largely stable, with the job market opening up again in various industries, giving people the confidence to take advantage of a property market that is at its most affordable for home buyers in years,” he added.
***
Home Sales, New Launches See Quarterly Improvement In 4 2020January 11, 2021: After touching record low levels amid the Coronavirus outbreak and the following lockdowns, housing markets in India’s eight prime residential markets have shown some signs of revival, with improvements in launch and sales numbers during October-December 2020.
PropTiger.com data show housing sales in India’s eight prime residential markets including Ahmedabad, Bengaluru, Chennai, NCR (includes Gurgaon, Noida, Greater Noida, Ghaziabad and Faridabad) , Hyderabad, Kolkata, MMR (includes Mumbai, Navi Mumbai and Thane) and Pune hit 58,914 units, a 68% increase over the July-September period of 2020. An annual comparison of these numbers with the data for Q4 2019, however, shows a decline of 27%.
Similarly, a total of 54,329 new units were launched in the October-December period of 2020 across the eight markets covered in the analysis, showing a 173% Quarter-on-Quarter (Q0Q) growth in new supply. The numbers also reflect a year-on-year (YoY) increase of 12%, when compared to the data for the corresponding period in 2019.
Barring Ahmedabad, there has been a quarterly increase in launches across markets, a city-wise break-up of launches shows in Q4 2020. The highest number of units were launched in Hyderabad, Pune and Mumbai, respectively.
According to Real Insight: Residential Annual Roundup 2020, much of this improvement in sales and launches could be attributed to the combined efforts of central and state governments, the RBI and the developer community.
“The quarterly spike in supply numbers could largely be attributed to the increased popularity of residential realty in the aftermath of the Coronavirus pandemic that has laid bare the insecurities of other asset classes. Various government-offered support measures to provide a cushion to the developer community, have also provided them with some scope to launch new schemes,” the report says.
"All factors considered, the sector has shown remarkable tenacity in 2020, against unprecedented odds that have caused the economy to contract and impacted consumer spending. The fact that housing sales in India's key markets have started to bounce back, in spite of the general gloom caused by the pandemic, shows the immense potential of the real estate sector, which employs the highest number of unskilled workers in the country. The sector's performance seems particularly impressive, given that the pandemic has impacted the income-generating capacity of a large number of people. End-users and investors continue to feel confident about investing in real estate. Prices continued to remain stable and the overall outlook looks positive,” said Dhruv Agarwala, group CEO, Housing.com, Makaan.com and PropTiger.com.
Break-up of sales and launches in 8 cities in Q4 2020
City | Launches | Sales |
Ahmedabad | 3,003 | 3,125 |
Bengaluru | 6,104 | 7,660 |
NCR | 5,120 | 6,065 |
Chennai | 4,887 | 3,180 |
Hyderabad | 12,723 | 6,487 |
Kolkata | 1,658 | 2,518 |
MMR | 10,070 | 18,331 |
Pune | 10,764 | 11,548 |
Total | 54,329 | 58,914 |
Source: Real Insight: Residential Annual Roundup 2020
To read the full report, click here.
"While the trends point to a market recovery and positive news, given the imminent launch of a vaccine that will ease the pandemic concerns, our optimism should be cautious. Buyers continue to expect low home loan rates, extension of developer offers and prefer ready-to-move-in inventory than those under construction. We believe that the government should continue to support the sector, through moves such as lowering stamp duty, re-evaluating circle rates and increasing the tax deduction limit for interest on home loans, to ensure that the sector continues to revive. The sector is digitising at a rapid pace and more than 90% of potential home buyers have moved online, to shortlist properties to buy. We have seen a strong growth in online booking throughout 2020,” added Mani Rangarajan, Group COO, Housing.com, Makaan.com and PropTiger.com.
Unsold stock: City-wise break-up
After undergoing a 9% decrease annually in Q4 2020, the unsold stock in India’s eight markets stood at 7,18,483 units as on December 31, 2020. However, the average inventory overhang - the estimated time builders should take to sell off the existing unsold stock at the current sales velocity - has increased to 47 months as of December 2020, as compared to 27 months in December 2019.
At 55% combined, Mumbai and Pune continue to hold the highest share in the unsold stock and the inventory overhang is the highest in the NCR at 72 months. On the other hand, Hyderabad has the lowest inventory overhang of 29 months.
City | Unsold stock on December 31, 2020 (units) | Inventory overhang (in months) |
Ahmedabad | 38,069 | 38 |
Bangalore | 71,133 | 36 |
Chennai | 35,583 | 42 |
Hyderabad | 39,234 | 29 |
Kolkata | 30,060 | 40 |
MMR | 2,67,398 | 58 |
NCR | 1,06,560 | 72 |
Pune | 1,29,199 | 40 |
National average | 7,18,483 | 47 |
Source: Real Insight: Residential Annual Roundup 2020
Price growth remains flat in Q4 2020 amid demand-side pressure
Property values of newly launched projects across cities in the one-year period also largely remained flat, except in Ahmedabad and Hyderabad. Annual per sq ft values of new properties in Ahmedabad and Hyderabad increased by 7% and 5%, respectively, in Q4 2020 when compared to Q4 2019.
Growth of average prices has been flat in the NCR and MMR markets, considered among some of the most expensive property markets in the world, on concerns of material supply, aggravated construction costs and labour shortage.
Price growth: City-wise break-up
City | Average price as on December 31, 2020 (in Rs per sq ft) | Annual growth in % |
Ahmedabad | 3,213 | 7 |
Bengaluru | 5,342 | 2 |
Chennai | 5,228 | 2 |
Hyderabad | 5,602 | 5 |
Kolkata | 4,202 | 2 |
MMR | 9,448 | No change |
NCR | 4,268 | No change |
Pune | 5,077 | 4 |
National average | 6,042 | No change |
Source: Real Insight: Residential Annual Roundup 2020
***
Housing Markets Inch Towards Recovery In Sep Quarter: PropTiger ReportOctober 14, 2020: The affordable housing segment continues to play an instrumental role as India’s residential real estate market attempts to spring back to its feet after taking a severe beating on account of the Coronavirus pandemic. According to Real Insight Q3 2020, a quarterly analysis of key market indicators in India’s prime residential markets of Ahmedabad, Bangalore, Chennai, Hyderabad, Kolkata, the Mumbai Metropolitan Region (MMR) , the National Capital Region (NCR) and Pune, housing units in the sub-Rs 45-lakh price bracket made the biggest contribution to home sales during the July-September quarter (Q3) of 2020, contributing 45% to overall sales numbers. A total of 35,132 units were sold during the period between July and September 2020, an increase of 85% from the previous quarter. When compared to the same period in 2019, however, sales show a decline of 57%.
On the supply side, too, the affordable housing segment played a big role. Of the 19,865 new units launched during the three-month period, 43% were from the sub-Rs 45-lakh price bracket. New supply also saw a quarter-on-quarter increase of 58%.
Recall here that under the income tax laws in India, housing units worth up to Rs 45 lakhs qualify as affordable homes.
“Green shoots are visible, pointing to the start of a recovery in residential real-estate, evidenced by the improvement in new launches and sales on a quarter-over-quarter basis. These are unprecedented times, which have made buyers aware of the important role that homes play in ensuring their well-being, as well as their physical and emotional security. This, together with the fact that real estate is a hard asset and the fact that home loan rates are near a 15-year low, have encouraged buyers to return to the market. In recent times, the government and the Reserve Bank have also taken steps, to enhance liquidity in the sector and encourage banks to extend home loans at cheaper rates. With several macro-economic indicators showing a positive trend in September, we may well be on the road to a more sustained recovery and the upcoming festival season will be critical, in determining the growth trajectory in the sector over the next 12 months,” said Dhruv Agarwala, group CEO, Housing.com, PropTiger.com and Makaan.com.
While new launches increased 58% when compared to the April-June period of this year, they fell by 66% when compared to the corresponding period of 2019, data show.
The annual comparison is indicative of the fact that housing markets in India are a long way from reaching their pre-COVID-19 levels, which itself had been quite lacklustre in the past half-a-decade, because of an overall slowdown in the housing market.
Key numbers for July-September quarter 2020
Sales | Up 85% qoq | Down 57% yoy |
Launches | Up 58% qoq | Down 66% yoy |
Source: Real Insight Q3 2020
Price growth remains flat
Even though polls are predicting a fall of 10% in property values in 2020 on account of the Coronavirus pandemic, prices of apartments in key markets have not undergone any significant reduction. Markets like Ahmedabad and Hyderabad have, in fact, shown some upward movement in average property values on an annual basis.
“Consumers continue to perceive real-estate as the most stable asset and a number of them are looking to upgrade their homes, as working from home is likely to continue. The government has also been supportive, by taking steps to make buying more attractive. While states such as Maharashtra have reduced stamp duty rates on property transactions, financial institutions have also brought home loan interest rates to the sub-7% level since the RBI brought the repo rate to 4%. On its part, the developer community is not only ensuring buyers are able to book their future homes using virtual tools but also offering festive discounts and easy payment plans. We are optimistic that sales during the festive season will be encouraging and will help drive further recovery in the sector,” says Mani Rangarajan, group COO, Housing.com, Makaan.com and PropTiger.com.
Average property prices in key markets
Weighted average property prices in top 8 residential markets
City | Average price as on September 2020 (in Rs per sq ft) | Percentage change over September 2019 |
Ahmedabad | 3,151 | 6% |
Bangalore | 5,310 | 2% |
Chennai | 5,240 | 2% |
NCR | 4,232 | -1% |
Hyderabad | 5,593 | 6% |
Kolkata | 4,158 | 1% |
MMR | 9,465 | 1% |
Pune | 4,970 | 2% |
National average | 6,066 | 1% |
Source: Real Insight Q3 2020
Overhang increases even though unsold stock reduced by 12% yoy
As supply remained limited, with developers showing caution in launching new projects, the unsold inventory in the eight markets reduced by 12% yoy and 2% qoq. Barring Hyderabad, where unsold inventory increased by 3% as compared to the previous quarter, due to an influx of new supply, all the other cities covered in the analysis witnessed a reduction in unsold inventory in the range of 1%-5% as compared to the previous quarter.
While the national inventory overhang increased from 28 months in September 2019 to 43 months in September 2020, it remained the highest in the NCR, at 58 months. Inventory overhang is the estimated time period within which developers will be able to sell off the current stock. This projection is made, keeping in view the current sales velocity.
Inventory stock and overhang in top eight markets
City | Inventory as on September 30, 2020 (units) | Inventory overhang (in months) |
Ahmedabad | 38,736 | 31 |
Bangalore | 72,754 | 36 |
Chennai | 34,902 | 39 |
Hyderabad | 33,072 | 25 |
Kolkata | 31,070 | 39 |
MMR | 2,72,248 | 52 |
NCR | 1,07,634 | 58 |
Pune | 1,32,652 | 37 |
National | 7,23,068 | 43 |
Source: Real Insight Q3 2020
To read the full report, click here.
***
Home Sales Dip By 79% In June Quarter, New Supply Falls By 81%: PropTiger ReportJuly 29, 2020: Any chances of a recovery for real estate in India, which has been reeling under the impact of a demand slowdown for the past five years, have been toppled by the Coronavirus pandemic, housing sales and supply numbers available with PropTiger.com show.
According to Real Insight: Q2 2020, a quarterly analysis of eight prime residential markets in India, only 19,038 units were sold during the period between April and June 2020, when the government had imposed strict travel restrictions in order to contain the virus' spread. The adverse effect of the pandemic was even more pronounced on new supply, as only 12,564 units were launched during the three-month period.
In percentage terms, housing sales declined 79% annually while falling 73% QoQ. Similarly, new supply dipped 81% annually while falling 65% QoQ.
Click here to read the full report.
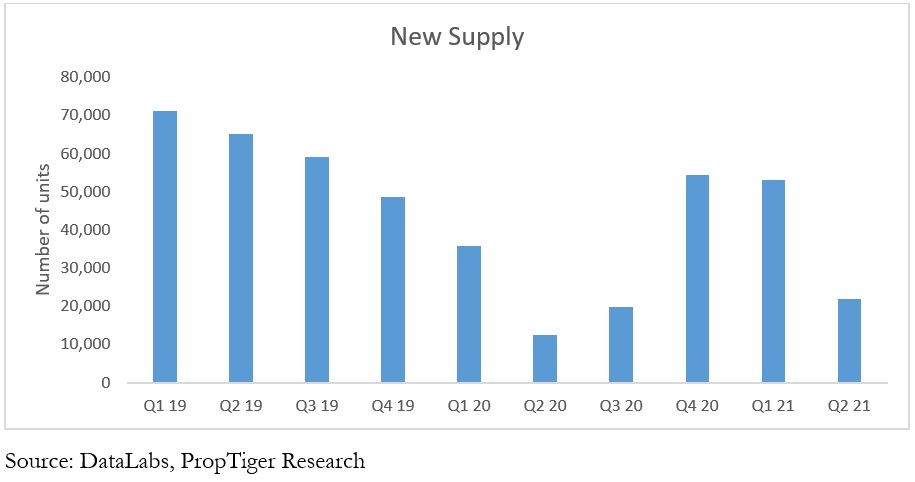
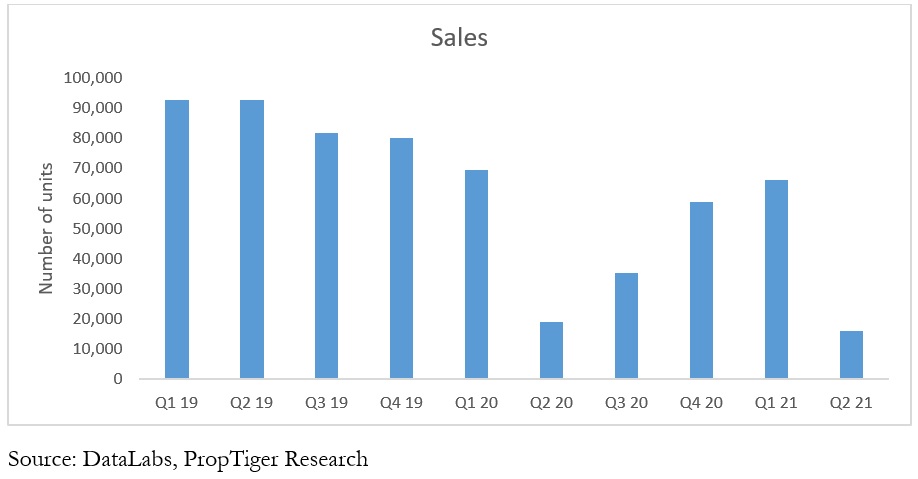
Launch and sales numbers
| Launches (units) | Sales (units) |
Q1 2018 | 79,943 | 84,775 |
Q2 2018 | 78,574 | 85,053 |
Q3 2018 | 64,569 | 88,935 |
Q4 2018 | 73,621 | 91,965 |
Q1 2019 | 71,270 | 92,683 |
Q2 2019 | 65,238 | 92,764 |
Q3 2019 | 59,216 | 81,886 |
Q4 2019 | 48,530 | 80,253 |
Q1 2020 | 35,668 | 69,555 |
Q2 2020 | 12,564 | 19,038 |
Source: Real Insight: Q2, 2020
“The current pandemic is an unprecedented black swan event that is expected to contract growth in the global economy, including that of India. As anticipated, demand was adversely impacted due to economic uncertainty, combined with growing unemployment. Our recent Housing.com-NAREDCO buyer survey indicated that buyers have pushed back their purchasing decision by up to a year. While, developers are increasingly offering schemes, such as flexible payment plans, selective discounts and price protection plans, to attract buyers, they are understandably cautious and are focusing on completing existing projects. In fact, the delivery of existing projects may get pushed back, depending on how quickly supply-chain, labour availability and liquidity inflows are restored. We are unlikely to see new launches increase significantly for the next few quarters, as developers wait for demand revival and augment their cash flows through the sales of existing units. Notwithstanding these lacklustre results, buyers continue to affirm their faith in real estate as an asset class, with over a third of our surveyed buyers choosing it as their preferred form of investment," says Mani Rangarajan, Group COO, Housing.com, Makaan.com and PropTiger.com.
Inventory overhang at 35 months
When compared to the levels seen during the same quarter last year, unsold stock declined 13% in the eight cities, primarily on account of a fall in new launches. As on June 30, 2020, developers had an inventory consisting of 7,38,335 units across these markets. In Q2 2019, the unsold stock stood at 8,46,460 units.
At 55%, Mumbai and Pune markets together contributed the highest share of unsold stock, followed by NCR (15%) and Bengaluru (10%) .
Inventory overhang, however, has increased to 35 months as against 28 months last year. Inventory overhang is the time developers would take to sell off the unsold stock, at the current sales velocity. The NCR market has the highest inventory overhang as of now, while Hyderabad has the lowest, at 19 months.
Inventory burden
City | Inventory overhang (in months) |
Ahmedabad | 26 |
Bengaluru | 32 |
Chennai | 36 |
Hyderabad | 19 |
Kolkata | 38 |
MMR | 40 |
NCR | 53 |
Pune | 30 |
Data as on June 30, 2020
Source: Real Insight: Q2, 2020
Price card
While some noteworthy movement was seen in Hyderabad and Ahmedabad housing markets, in terms of price appreciation, rates largely remained range-bound in most other cities. However, rates have not undergone any correction either in the past one year.
City | Weighted average price (per sq ft) | Annual growth in Q2 2020 |
Ahmedabad | Rs 3,104 | 6% |
Bengaluru | Rs 5,299 | 3% |
Chennai | Rs 5,138 | Flat |
Hyderabad | Rs 5,505 | 7% |
Kolkata | Rs 4,178 | 3% |
MMR | Rs 9,490 | 1% |
NCR | Rs 4,293 | 1% |
Pune | Rs 4,951 | 2% |
Data as on June 30, 2020
Source: Real Insight: Q2, 2020
Note: Cities included in the analysis are Ahmedabad, Bengaluru, Chennai, Hyderabad, Kolkata, NCR, MMR and Pune.
***Housing Sales Drop 26% In Q4 Amid Corona Scare: PropTiger
May 27, 2020: If India’s real estate sector was finally looking forward to restoration of normalcy, after a prolonged demand slowdown, the Novel Coronavirus outbreak has dashed all its hopes. According to a report by PropTiger Datalabs, housing sales in India’s nine prime residential markets saw an annual decline of 26 per cent for the last quarter (Q4) of the financial year 2019-20 (FY20) . The report, titled Real Insight-Q4 FY20, also shows that new launches in these markets fell by 51 per cent year-on-year during the January-March period, amid the government announcing a 40-day lockdown, to slow down the spread of the virus in India.
Particulars | No of units in Q4FY20 | Quarterly change | Yearly change |
Launches | 35,668 | -27% | -51% |
Sales | 69,235 | -11% | -26% |
Inventory | 738,898 | -6% | -15% |
Source: Real Insight: Q4FY20
Sales, launches fall across cities
During the quarter, new supply and sales fell across the nine markets ─ Ahmedabad, Bengaluru, Chennai, Gurugram, Hyderabad, Kolkata, Mumbai, Pune and Noida ─ covered in the analysis. While Gurugram saw the sharpest fall in sales (-73 per cent YoY) , Ahmedabad witnessed the steepest decline in new launches (-96% annually) .
The report adds that housing sales and launches will continue to fall in Q1 of FY21, because of the Coronavirus outbreak and the subsequent lockdown.
“Owing to the unprecedented health emergency, India has imposed a 40-day lockdown till May 3, 2020, to stem the Coronavirus infections. The severe restriction on people’s movement, will have an adverse impact on both, sales and launches, in Q1FY21. Consequently, there might not be much relief for developers from the existing inventory burden,” it says.
“While the Chinese economy has been reeling under the impact of the Coronavirus contagion since December 2019, the situation started to get worrisome in India only towards March 2020. Following the spike in number of infections, the government first announced a 21-lockdown on March 24 and then, extended it till May 3, keeping in mind the severity of the situation. The lockdown, which has virtually brought to a standstill all economic activity in the country, has been detrimental to all sectors, including real estate. While there is no questioning the merit of the lockdown, its adverse impact is visible on housing sales and launches in the last quarter of last fiscal,” says Dhruv Agarwala, group CEO, Elara Technologies.
“While the short-term negative impact of the pandemic on sales and launches can’t be negated, we expect the various support measures announced by the government and the RBI, to yield positive results in the medium term,” Agarwala adds. He also says the lockdown is likely to bring about a major change in consumer behavior, going forward. "Early indications are already there. While physical site visits to properties have stopped completely, online searches, as well as online bookings of apartments continue to take place. The adoption of digital platforms is likely to go up in the coming months. Much like mobile phone manufacturers that launch new products on a digital platform before a launch on traditional offline channels, we believe several real estate firms, particularly the reputed names, will adopt a similar strategy in the coming weeks and beyond,” Agarwala says.
Inventory declined 15%
Housing inventory reduced by 15 per cent during the quarter ending March 31, primarily because not many fresh units were added during this period. As on March 31, 2020, real estate developers in the nine residential markets were sitting on a housing inventory of 7,38,898 units and at the current sales velocity, they would take 27 months to sell this stock , shows the report.
As for the concentration of this unsold stock, the Mumbai Metropolitan Region (MMR) and Pune contribute the most to the inventory. Together, these markets in western India have over 4.18 lakh unsold homes.
Price rise continues in Hyderabad
On the pricing front, Hyderabad continued to show positive annual growth, with prices increasing by nine per cent during the quarter when compared to the same period of the earlier fiscal. In other markets, the growth has been dismal. Prices, however, showed only a slight downward movement in Gurugram, falling by one per cent in the past one year. Prices did not fall in any other market in the past one year, shows the report.
***
Festive Season Fails To Boost Sentiment; Housing Sales Fall 30% In Q3: PropTiger ReportJanuary 15, 2020: The festive spirit failed to give a boost to the muted buyer sentiment in India as housing sales numbers continued to show a decline in Q3FY20 amid expectations of an improvement. According to Real Insight, a quarterly analysis of India’s nine prime residential markets by PropTiger.com, home sales during the October-December 2019 period declined by 30 per cent when compared to the same period last year. Sales fell across cities during the quarter, indicating a nation-wide phenomenon.
Amid aggravating liquidity concerns, project launches also continued to fall, registering a 44 per cent decline in Q3FY20 when compared to Q3FY19. Project launch numbers also showed decline across cities.
“Several measures launched by the government in the past to revive real estate growth seem to have made little impact. The sector being a major contributor to overall growth, which hit 4.5 per cent in the July-September period, we expect further assistance from the government, which would nudge buyers to invest in realty. In the Union Budget, we expect finance minister Nirmala Sitharaman to announce measures resulting in higher savings for individual taxpayers, thus, prompting them to get back to property investments,” says Dhruv Agarwala, Group CEO, Elara Technologies.
The numbers analysis
Q3FY19 (no. of units) | Q3FY20 (no. of units) | Percentage change | |
Sales | 91,464 | 64,034 | -30% |
Launches | 73,226 | 41,133 | -44% |
Inventory | 883,483 | 774,860 | -12% |
Source: Real Insight-Q3FY20
When compared to the levels seen last year, the unsold housing stock reduced by 12 per cent during the quarter ended December 31, 2019 offering some relief to developers for whom inventory is a big burden amid an ongoing demand slowdown.
As against over 8.83 lakh units, developers now have nearly 7.75 lakh units of unsold stock in the nine markets, including Ahmedabad, Bengaluru, Chennai, Gurugram, Hyderabad, Kolkata, Mumbai, Noida and Pune. At the current sales velocity, builders would take 29 months to sell off the existing stock.
Mumbai and Pune together contribute 57 per cent of this unsold stock, the report shows.
The outliers
Major contributor: Mumbai continues to see the most action, contributing 40 per cent to both, launch and sales numbers in Q3.
Affordable housing: Affordable housing continued to dominate launches as well as sales. While 52 per cent units were launched in this segment during the quarter, affordable homes had a 56 per cent share in overall sales numbers in Q3.
Affordable homes are units priced within the Rs 45-lakh budget.
Ready versus under-construction: Nearly 53,000 such units were sold during the quarter while over 11,000 flats sold in Q3 were under-construction homes.
Pricing: Average property values also showed upwards movement across cities during the quarter, even if only marginally. The price rally, however, continued for India’s pharmaceutical capital Hyderabad, where average property rates increased 13 per cent year -on- year to reach Rs 5,318 per square foot.
***
Home Sales, New Launches Decline In September Quarter: PropTiger ReportVarious measures launched by sector stakeholders are yielding only limited results as housing sales in India’s nine key markets declined by 25 per cent during the July-September quarter this year, when compared to the same period last year.
According to Real Insights, a quarterly analysis of key residential markets in the country by PropTiger Datalabs, new unit launches fell by 45 per cent in the September quarter year-on-year (y-o-y) , while housing sales fell by 25 per cent. The only positive news was the reduction in unsold housing stock, with inventory declining by 13 per cent over the July-September quarter in FY19.
As against 61,679 fresh units launched in Q2 FY19, only 33,883 new homes were launched in Q2FY20. Of these, 41 per cent were priced at Rs 45 lakhs or less. While new launches declined across cities during the quarter except Gurugram, the highest share of fresh units during the three-month period, was claimed by Mumbai and Pune
A total of 65,799 units were sold during the quarter ending September this year as against 88,078 units during the corresponding quarter the previous year. Nearly half the units sold during the quarter were affordable homes.
“While new launch numbers might continue to fall in the coming quarters amid the liquidity crunch, we expect home sales numbers to improve, factoring in the festive spirit. Record low interest rates would encourage buyers this festive season,” says Dhruv Agarwala, Group CEO, Elara Technologies.
This could further lower the inventory, especially in affordable housing. More than half the unsold stock currently lying in India’s prime residential markets are affordable homes, shows data. Developers currently have a total unsold stock comprising of over 7.78 units.
The report covers the residential markets of Ahmedabad, Bengaluru, Chennai, Gurugram, Hyderabad, Kolkata, Mumbai, Noida and Pune. It shows that price movement in most cities has been negligible in the past one year, except Hyderabad where, property values have appreciated 15 per cent in the past one year. Barring Gurugram and Chennai where rates moved slightly downwards, prices also moved up in the range of 2-4 per cent.
The report also indicates that more than four lakh new units will be delivered in second half of the financial year. Another, 4.52 lakh ready-to-move-in homes are expected to join the market by FY21.